In Q2, phishing attacks targeting social media platforms increased more than 23%, according to Fortra’s PhishLabs. This is the greatest volume of attacks on social media in two years and puts the industry ahead of historically top targeted financial institutions.
Every quarter, Fortra’s PhishLabs examines hundreds of thousands of phishing attacks targeting enterprises and their brands. In this post, we break down the latest phishing activity, staging methods, and top-level domain abuse.
Q2 Phishing Targets
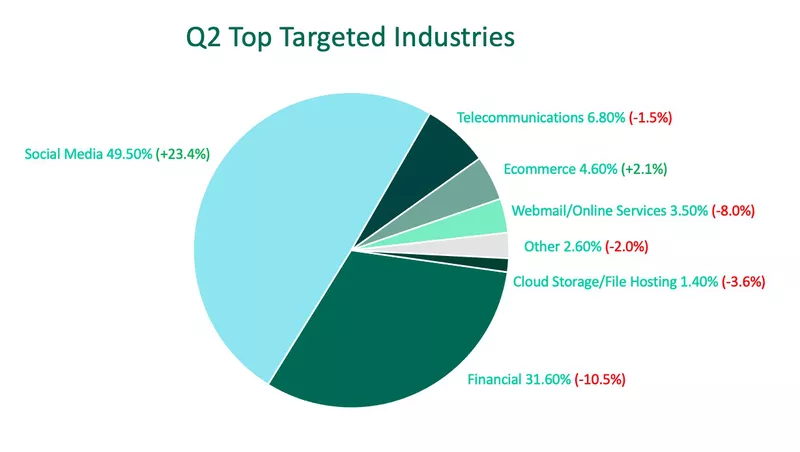
In Q2, social platforms were the favorite target of cybercriminals, pushing financials to the second spot. Financials have historically led all other industries in cyber abuse. Attacks on social media made up nearly half of all industry volume after a 23% quarter-over-quarter jump in activity.
Financial institutions experienced a decline in malicious activity of more than 10% for the second consecutive quarter, pushing the industry to the second spot. Financials made up 31.6% of Q2 phishing activity.
Telecommunications moved from the fourth to the third spot this quarter, despite experiencing a decline in activity. Cybercriminals targeted telecoms 1.5% less than Q1, making up 6.8% of overall volume.
Ecommerce was the only industry, other than social media, to see an increase in abuse by growing 2.1% and moving from the seventh to the fourth spot.
Other targeted industries include:
- Webmail / Online Services 3.5% (-8.0%)
- Other (Including Healthcare, Insurance, and Software-as-a-Service) 2.6% (-2.0%)
- Cloud Storage / File Hosting 1.4% (-3.6%)
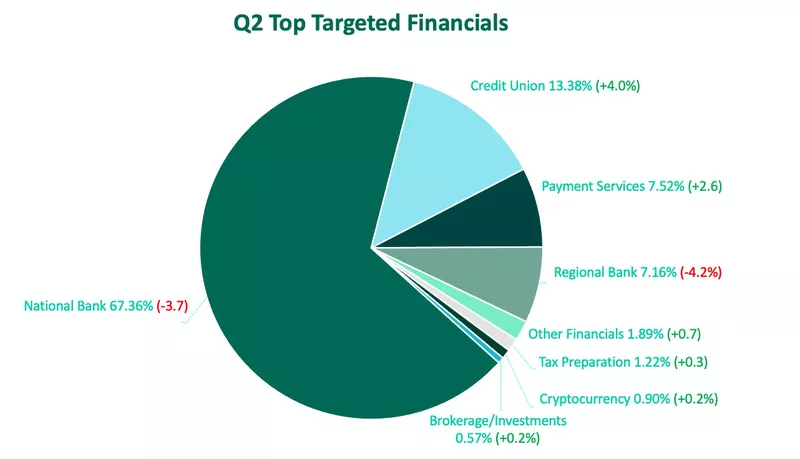
Looking at the financial industry specifically, there was a decrease in focus on larger banks and growing interest in smaller, less historically targeted institutions. National banks did remain in the top spot, with more than 67% of attack volume. This is, however, despite a nearly 4% decrease over Q1. Notably, credit unions were targeted 4% more in Q2, growing to 13.4% of total volume. This is the largest share of phishing attacks targeting credit unions since reporting on this datapoint.
Cybercriminals also targeted payment services more in Q2. Payment services saw a 2.6% increase in attacks, bringing the industry to 7.5% of overall volume. Similar to credit unions, this is the greatest share recorded in two years.
Regional banks saw the largest decline in activity in Q2, dropping from the second spot to the fourth with 7.2% of share.
Other financials, tax preparation, cryptocurrency, and brokerage/investments all experienced minor increases in Q2.
Staging Methods
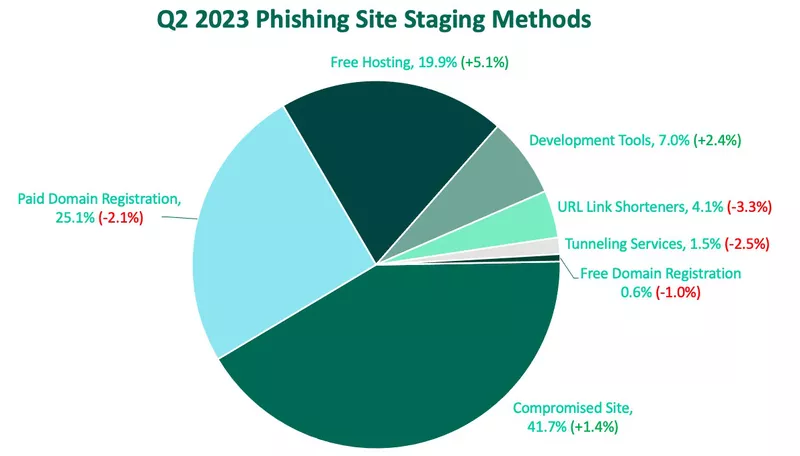
In Q2, 74.9% of phishing sites were staged using no-cost methods. These methods include compromising an existing website or using a free service for malicious purposes. The share of no-cost methods as a whole has increased slightly over Q2 partially due to a decline in Paid Domain Registrations.
The top staging method for cybercriminals in Q2 was compromising a website. Compromised sites grew 1.4% in share over Q1, making up 41.7% of total volume. This is just shy of the greatest share in volume for Compromised Sites recorded by PhishLabs in Q2 of 2022.
Paid Domain Registrations saw a slight decline after increasing for five consecutive quarters. Paid domains remain a popular choice for cybercriminals by making up a quarter of all staging volume.
Free Hosting saw the greatest increase in abuse in Q2, growing 5.1% of share over Q1. Free Hosting contributed to nearly 20% of staging methods. Cybercriminals also increased their use of Development Tools, moving from the fifth spot to the fourth with 7% of volume.
URL Link Shorteners, Tunneling Services, and Free Domain Registrations all declined in Q2, with Free Domain Registrations specifically demonstrating the lowest percentage of share since reporting on this data.
Top-Level Domain Abuse
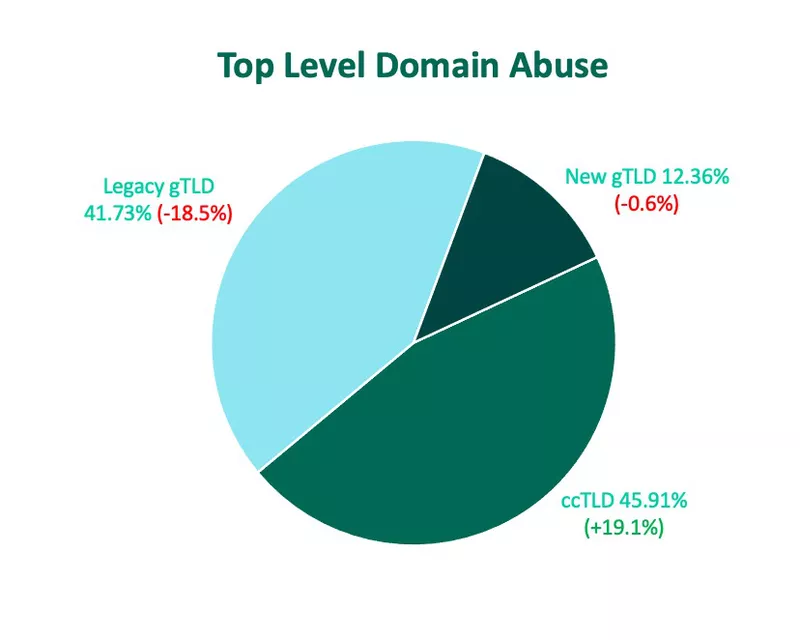
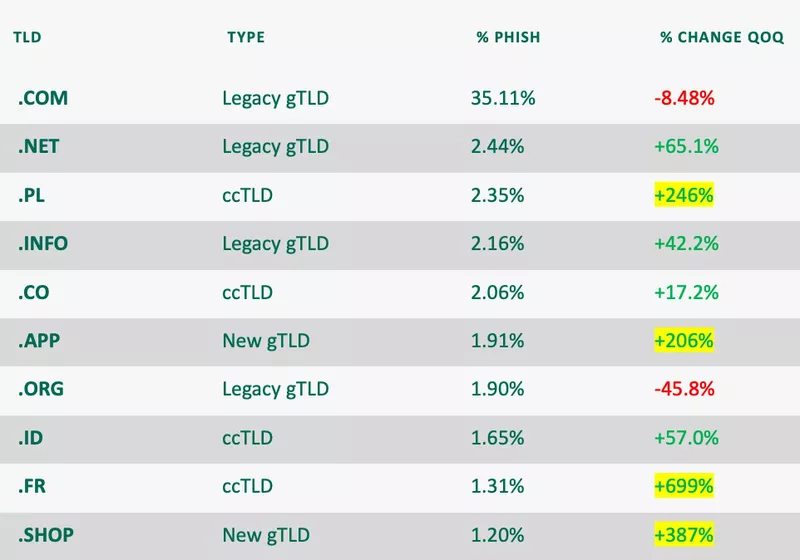
The TLD landscape underwent multiple changes from Q1 to Q2. Half of the top ten most abused TLDs were new to the group with several displaying significant increases. Additionally, for the first time since reporting on domain data, Country-Code TLDs (ccTLDs) were abused more than any other TLD type. Attacks abusing ccTLDs jumped nearly 20% in Q2, with overall share of volume totaling 46%.
Among the ccTLDs in the top ten, .PL and .FR increased nearly 250% and 700%, respectively, landing them in the third and ninth spots. The fifth most abused TLD was .CO (2.06%) after increasing 17%. ccTLD .ID (1.65%) was eighth, after an increase of 57%.
Legacy gTLD abuse dropped 18.5%, pushing the former leader to second place. The majority of Legacy gTLD volume was attributed to .COM, which, despite a quarter-over-quarter decline, still made up more than 35% of all TLD abuse. Notably, cybercriminals moved away from .ORG, and instead opted to abuse Legacy gTLDs .NET (2.44%) and .INFO (2.16%). Legacy gTLD .ORG (1.9%) declined almost 46% to land in the seventh spot from the second.
New gTLDs .APP and .SHOP made their debut to the top ten, after a 206% and 387% increase, respectively.
Cybercriminals continue to target industries with the tools that will deliver the most convincing and convenient attacks. The top targeted industry is liable to change from month to month and even quarter to quarter as cybercriminals identify organizations that may appear vulnerable. Understanding where your brand may be targeted and proactively identifying the resources used to build phishing infrastructures is key to preventing abuse.
Learn how PhishLabs can help your organization with phishing attacks.
